Monday, March 21, 2011
infographic sketches
1. sketch one is mapping out where various freak shows originated before they started traveling. The icon used would be the strongman icon.
2. sketch two is showing the most visited cities by freakshows and the different travel patterns in one "show season"
3. sketch three is a timeline of the evolution of the sideshow and how it came to be over time.
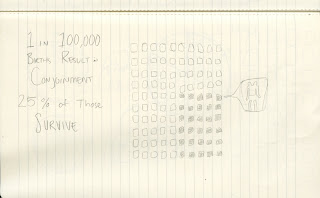
4. sketch four shows the rate of survival in Siamese twins
5. sketch five is graphing the ratio of 1 to 100,000.
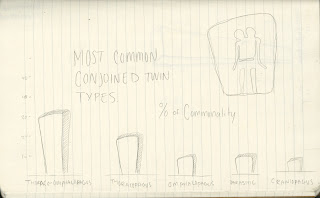
6. Types of conjoined twins
7. numbers of swords swallowed at one time by a single performer
8. the rate of survival in siamese twins
9. Performance time. performers go on every 20 minutes. two times an hour. 32 times a day. these are averages.
sources:
http://en.wikipedia.org/wiki/Ventriloquism
http://www.nfa.dept.shef.ac.uk/history/shows/freaks.html
http://www.sideshowworld.com/13-TGOD/ths-tgod.html
http://www.circusinamerica.org/public/transportation_modes
http://en.wikipedia.org/wiki/Conjoined_twins
http://en.wikipedia.org/wiki/Freak_show
http://books.google.com/books?id=hr-9GRxJfPEC&pg=PA51&lpg=PA51&dq=freak+shows+in+1901&source=bl&ots=N3TGBgX9Yw&sig=sQpsCMqsJhPQNkGmOlpYvMveatk&hl=en&ei=ISaETZmjJYaUtwfbg4jdBA&sa=X&oi=book_result&ct=result&resnum=1&ved=0CBgQ6AEwAA#v=onepage&q=freak%20shows%20in%201901&f=false
http://www.lastamericanfreakshow.com/
http://en.wikipedia.org/wiki/Sideshow
http://en.wikipedia.org/wiki/Conjoined_twins
http://www.swordswallow.com/records.php
http://www.swordswallow.com/halloffame.php
http://www.circusinamerica.org/public/structures
Subscribe to:
Post Comments (Atom)


No comments:
Post a Comment